So, the point of this project is to show employers that I know how to clean a dataset and use pandas. So here we go.
I went to data.gov to find some data to work with, and I came across some drug death data, which I would say is relevant to today and to me, because there is a massive drug problem in the this country and where I live (Seattle).
So to get started we have this pretty basic data set
After looking at the columns I decided a few things that I wanted to look at.
First was the drugs that are more prevelant in drug overdoses over the years, and some demographics about who was using what drugs.
First and for most I started to get to exploring the features and removing the ones I didn’t need and cleaning the ones I planned on using.
I decided to go ahead and check all of the NaN value counts in the dataset
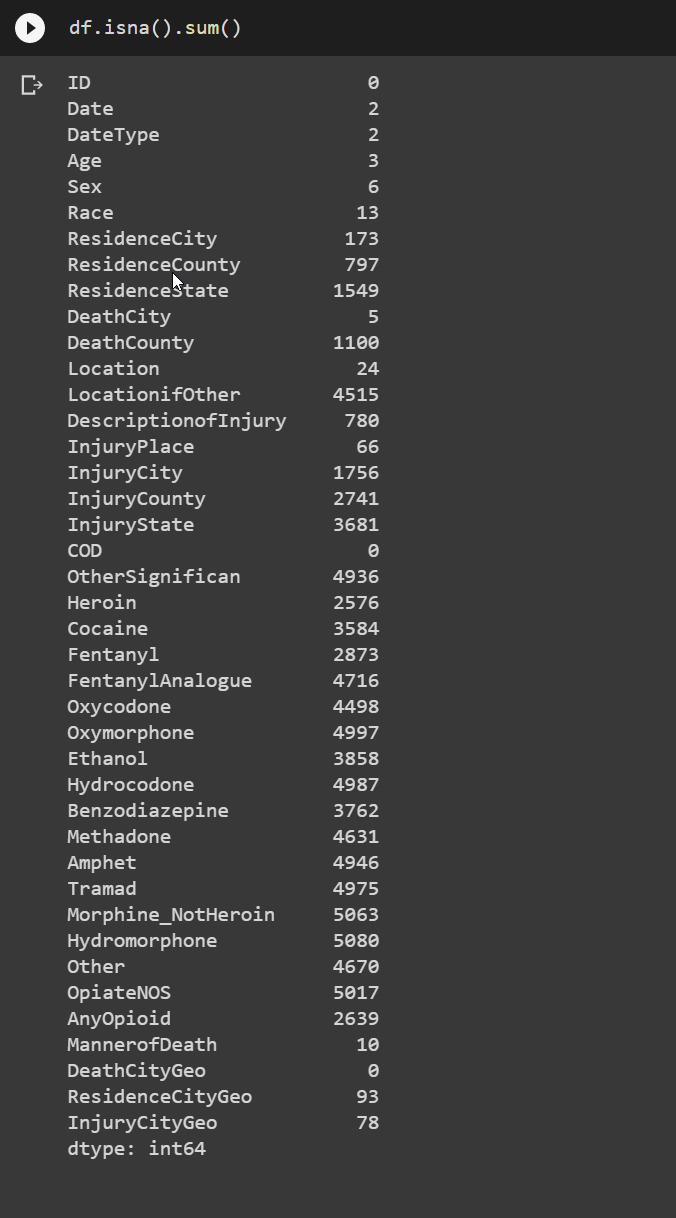
As I though we were going to have a ton of NaN’s for the individual drugs, because they are going to be either Y or NaN for each observation. I also didn’t plan on using a lot of the geo data. I probably would have if the data was national, but I have no strong connection to Connecticut, so to be honest, I wasn’t really worried about finding out what areas had more overdoses. However I did want to know some demographics about the overdoses, and the NaN count in those features were fortunetly low.
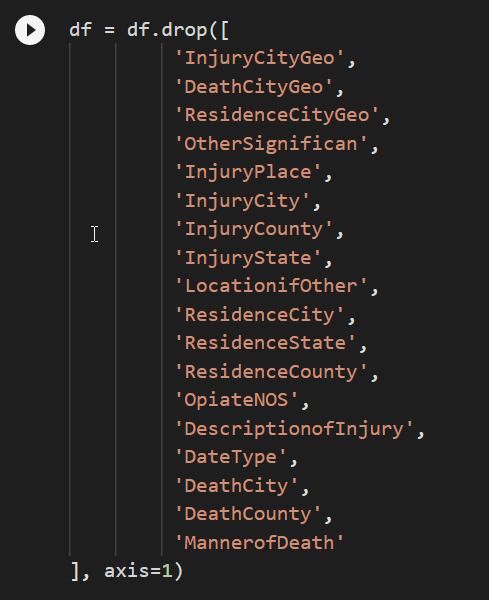
After going through, these are the columns I decided to drop from the dataframe.
Next I wanted to start the cleaning process, starting with all of the drugs. I first started by changing the drug features into binary/discrete features, and removing the NaN’s.
drug_list = ['Heroin', 'Cocaine', 'Fentanyl', 'FentanylAnalogue', 'Oxycodone',
            'Oxymorphone', 'Ethanol', 'Hydrocodone', 'Benzodiazepine',
            'Methadone', 'Amphet', 'Tramad', 'Morphine_NotHeroin',
            'Hydromorphone']

df[drug_list] = df[drug_list].replace({'Y': 1, None: 0})
Then the next step was to seperate the Date feature into a three day/month/year features.
df['Date'] = pd.to_datetime(df['Date'])

df['Year'] = pd.DatetimeIndex(df['Date']).year
df['Month'] = pd.DatetimeIndex(df['Date']).month
df['Day'] = pd.DatetimeIndex(df['Date']).day
After that, I decided to clean the Race, Sex, and Age features.
The age column only had 3 NaN’s. So I made the executive decision to drop those three observations.
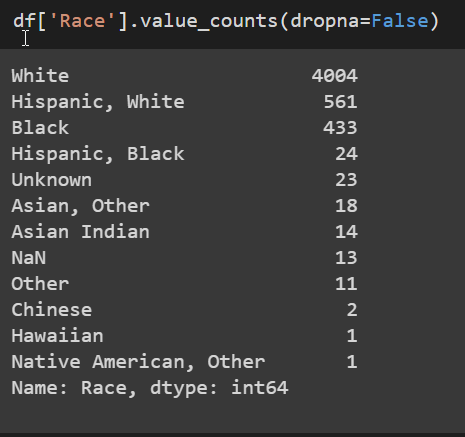
For the race feature, I merged some of the subcategories of races into the broader ones.
I had some issues with doing this, because I wasn’t sure if it was the best thing to do.
df['Race'] = df['Race'].replace(
    {'Hispanic, White'        : 'Hispanic',
     'Hispanic, Black'        : 'Hispanic',
     'Asian, Other'           : 'Asian',
     'Asian Indian'           : 'Asian',
     'Chinese'                : 'Asian',
     'Native American, Other' : 'Native American',
     'Other'                  : 'Unknown'
     }
)
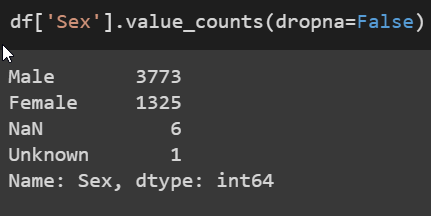
For the sex, I just took the 6 NaN values and merged them into the Other category
df['Sex'] = df['Sex'].replace({None:'Other', 'Unknown': 'Other'})
For the Location feature, there were a few options, but I reduced of few of them that were similar.
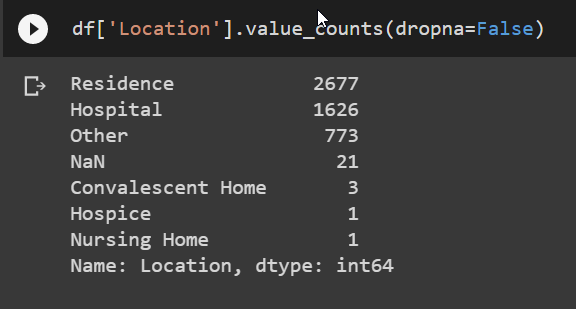
df['Location'] = df['Location'].replace({None:'Other', 'Convalescent Home':'Hospice', 'Nursing Home':'Hospice'})
The other feature included quite a bit of information on other drugs that were in the system.
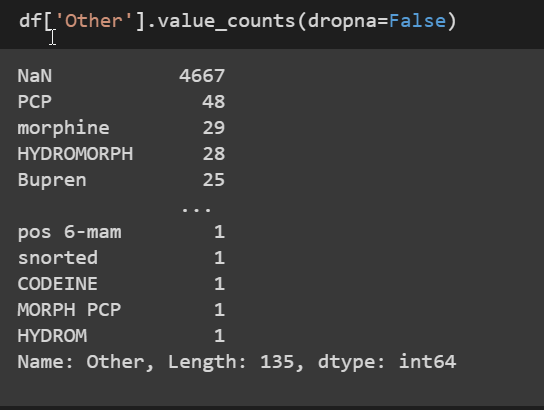
As you can see, there are a lot of user input drugs which allows for spelling errors and capitlization differences. So in this case I changed all of the text to lowercase with reduced the different inputs by 30. There were still 100 different types of other, so I just worked with the top values like PCP, Morphine, and Bupren.
To clean this up I created new drug columns for PCP and Bupren, then checked off the column(making it a 1) for each case that had PCP/Bupren in the other column. I also took the Morphine column and cross checked with the other column to make sure that if Morphine was in the other column that is was also marked in the Morphine Column.
df['Other'] = df['Other'].replace({None:'None'})

df['Other'] = df['Other'].map(lambda x: x.lower())

df['PCP'] = [1 if 'pcp' in x else 0 for x in df['Other']]
df['Bupren'] = [1 if 'bupren' in x else 0 for x in df['Other']]
drug_list = drug_list + ['PCP', 'Bupren']
As far as cleaning the features go, that was the bulk of it. There were a couple drug that had one or two more outliers in the columns, quick and easy fix.
However for fentanyl, I decided to merge the Fentanyl and FentanylAnalogue together as an Analogue is just a form of the original. It didn’t make quite a difference because in most cases, if FentanylAnalogue was checked, so was Fentanyl.
Now that I got the cleaning out of the way, It was time to make some fancy graphs.
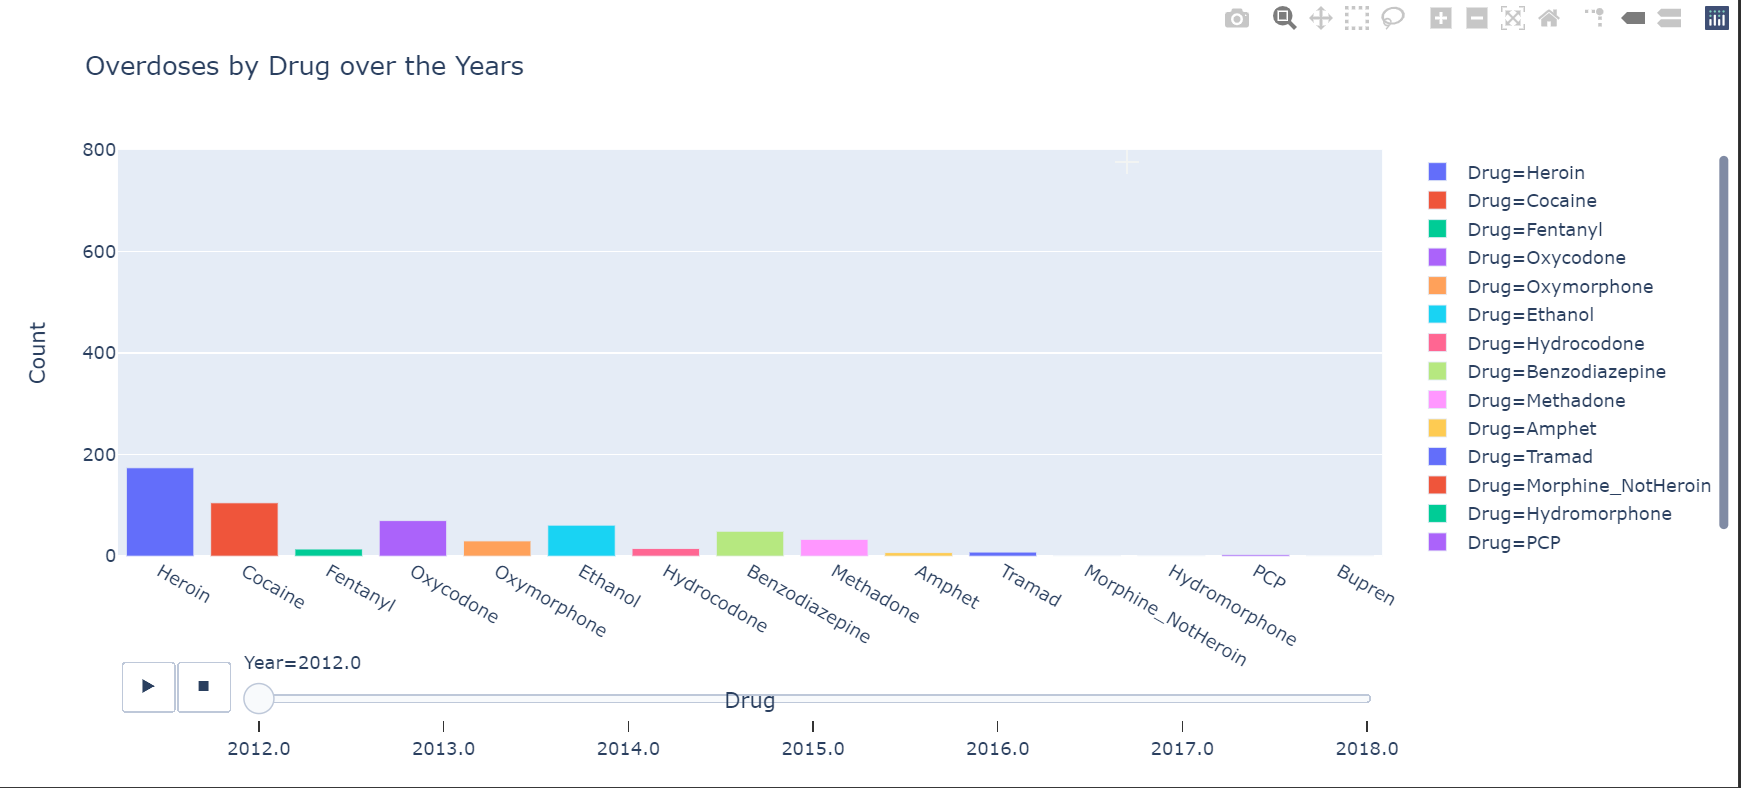
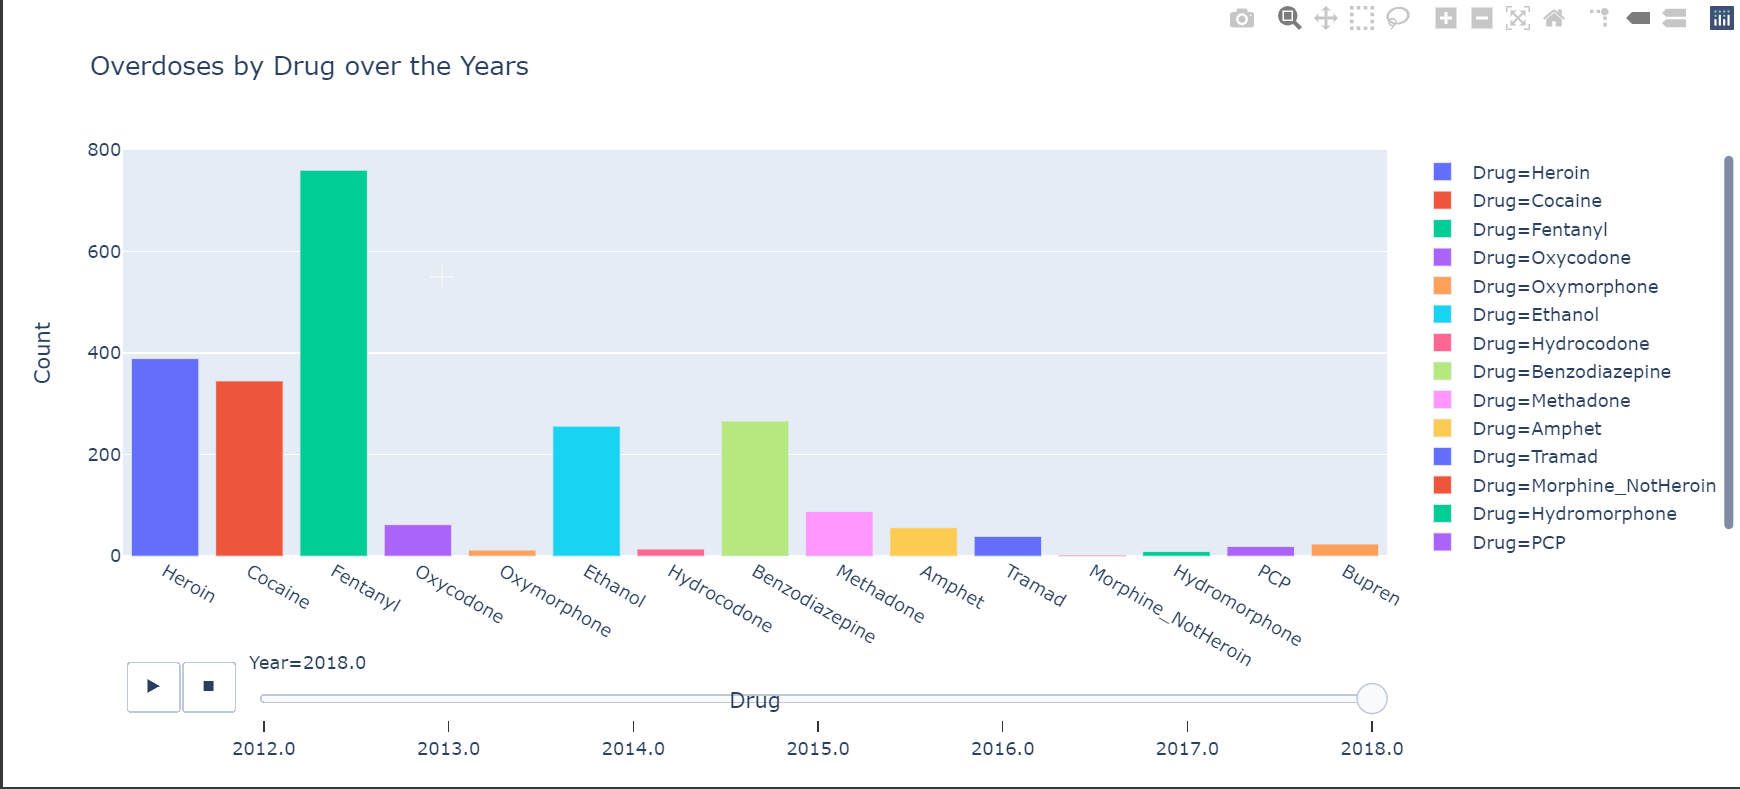
The chart I made was to show the different drug overdose cases over the year, showing which drug was more prevelant.
drug_year = df[drug_list+['Year']]
drug_year = pd.melt(drug_year.groupby('Year').sum(), ignore_index=False, var_name='Drug', value_name='Count')
drug_year.reset_index(level=0, inplace=True)
px.bar(drug_year,
       x='Drug', y='Count',
       color='Drug',
       animation_frame='Year', animation_group='Drug',
       range_y=[0, 800],
       title='Overdoses by Drug over the Years')
So I don’t think I can get interactive charts on markdown, so here are two images from the graph.
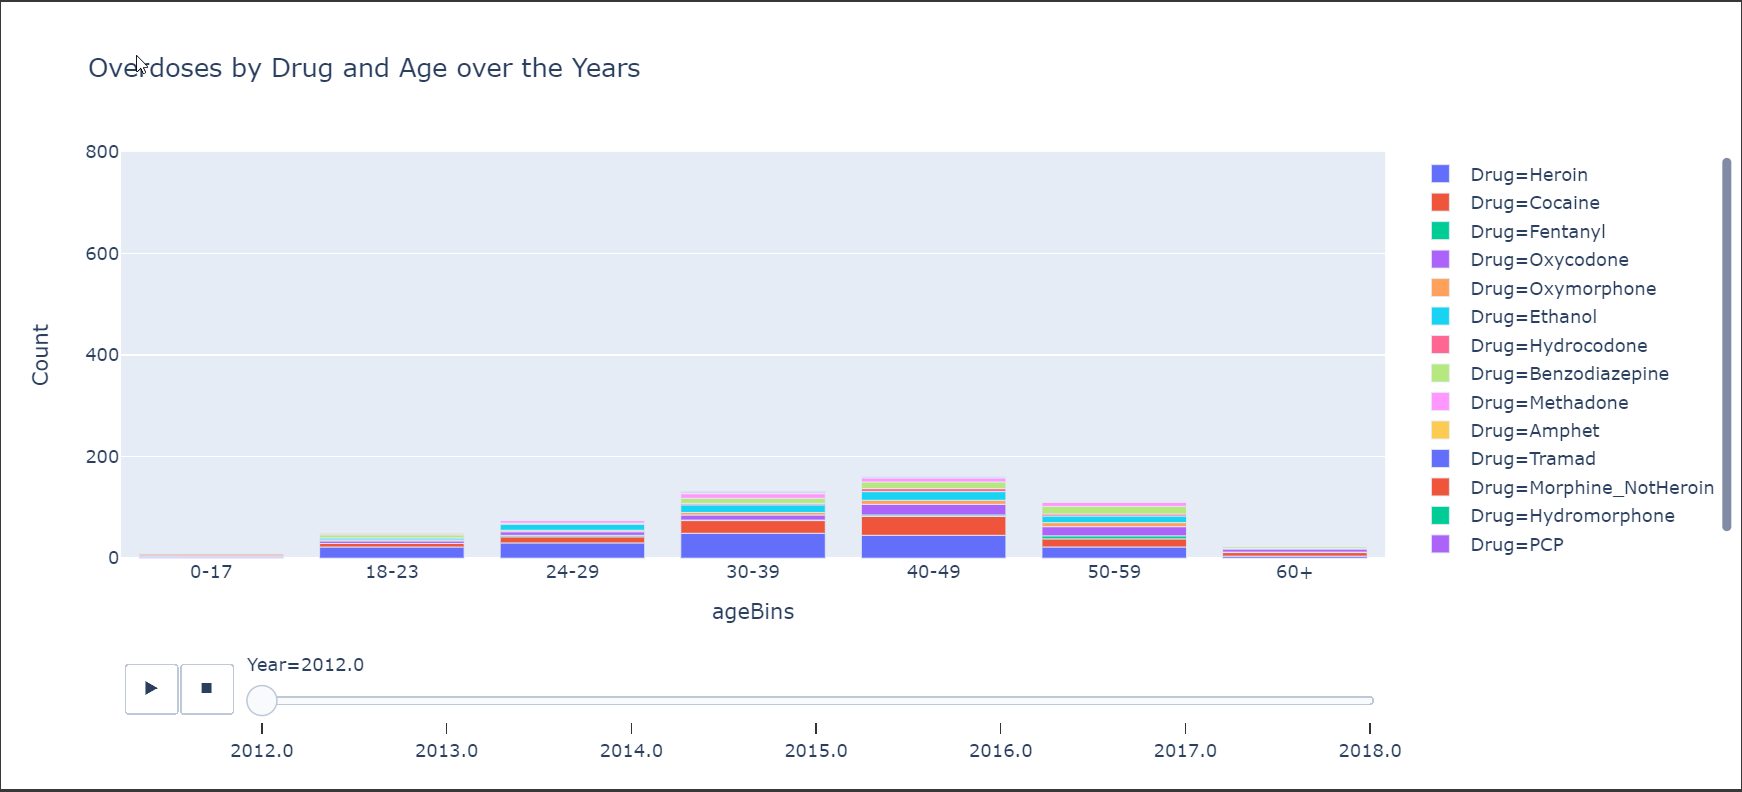
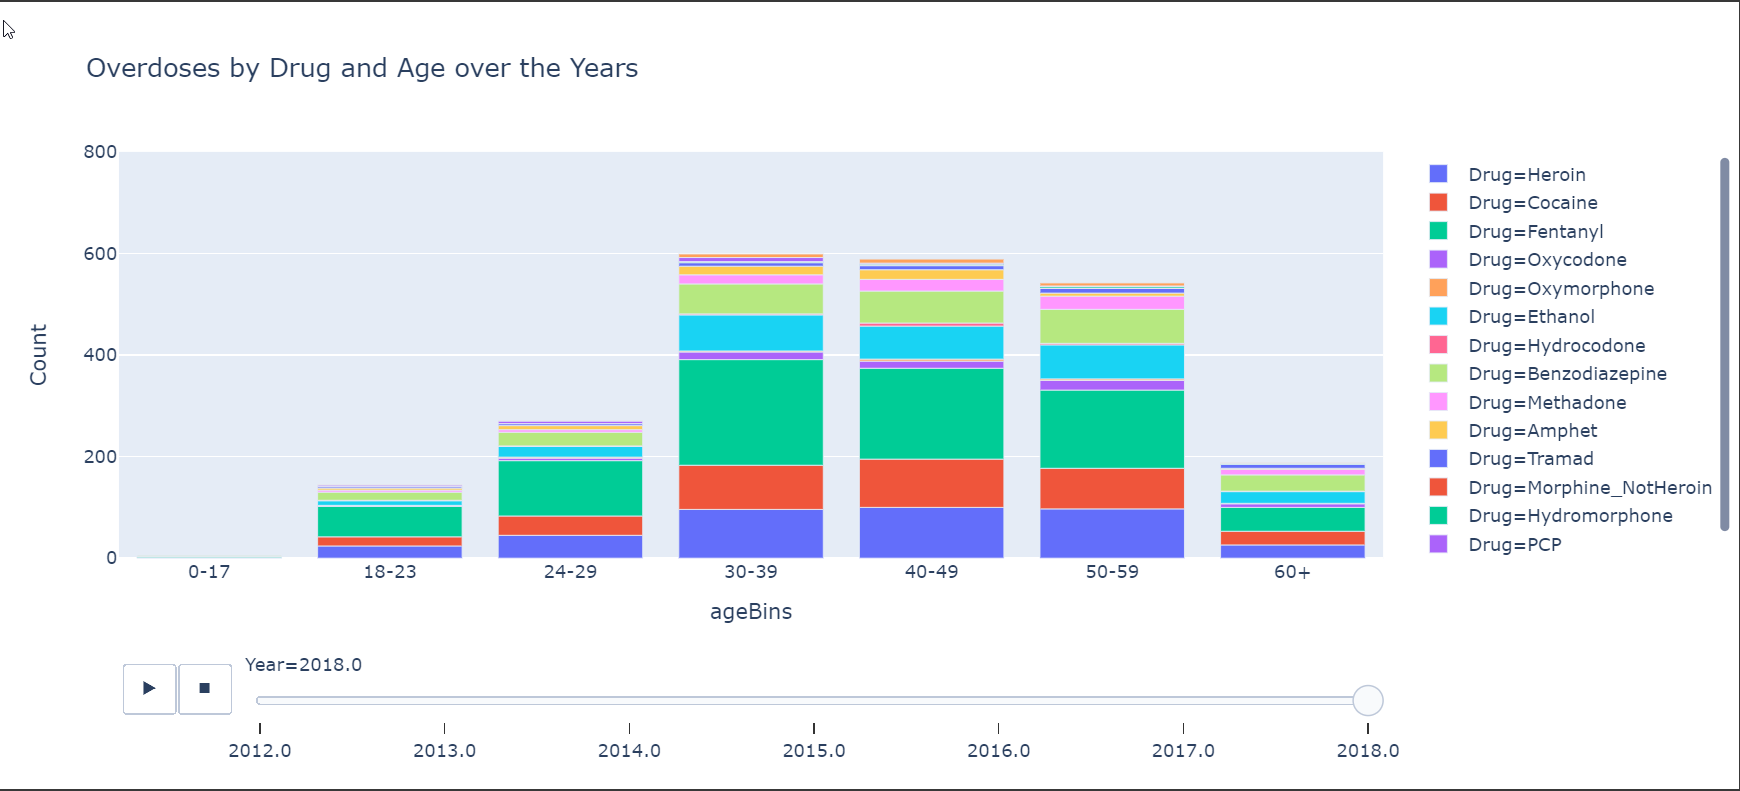
Here is another chart that shows the overdoses by Age Groups and also shows the more prevalent drugs.
Well That’s it!
Hopefully you enjoyed this if you just happen to come across it, or if you are an employer, hopefully this shows I have somewhat an idea of how to play with data with python and pandas. Obviously I only really used like 10% of pandas here. I didn’t post it, but I also played around with some crosstabs and pivot tables. But hey, if you already at the end of this post, You might as well call me in for an interview. Thanks for reading!